NIR and Optical Observations of the Transiting Super-Earth GJ 1214b
Since its discovery in 2009, the composition of the transiting “super-Earth” (M≤10Mearth) exoplanet GJ 1214b has been a topic of interest and debate. Its radius and distance, and the small size of its M dwarf host star (0.22 Rsun) causes a planet-to-star flux ratio comparable to that of a Jupiter-sized planet orbiting the Sun, making it one of only a handful of “super-Earth” atmospheres that can currently be investigated with transit observations (Charbonneau et al. 2009). GJ 1214b represents a unique opportunity to study a planetary object unlike those in our Solar System, yet potentially similar to a large fraction of currently-detected exoplanets, many of which are smaller than Jupiter-sized (Borucki et al. 2012; Muirhead et al. 2012; Borucki et al. 2010; Howard et al. 2010).
Transmission photometry and spectroscopy indicate the bulk composition of GJ 1214b by measuring the attenuation of stellar light as it passes through the limb of the exoplanet’s atmosphere. The modulation in the spectrum with wavelength increases with the atmosphere’s scale height, which is inversely proportional to the atmosphere’s molecular weight. Numerous observational and theoretical studies have tried to deduce the make-up of GJ 1214b’s atmosphere, but contradicting observations (in the same wavelength bands) and the active nature of the host star have kept the issue open. The two most contentious regions of GJ 1214b’s observed transit spectrum are in K-band (~2.15 μm) and in the optical blue region (≤0.7 μm). Depending on these (Rp/Rs) measurements, GJ 1214b’s atmosphere can be matched with various models: hydrogen-dominated+haze of small particles (~0.1 μm), N2- and H2O-dominated (small scale-height), hydrogen-dominated+thick clouds at/above 1 mbar, or hydrogen-dominated+haze of ≥1 μm particles.
I have accumulated observations in both of these contentious wavelength regions to help deduce the dominant atmospheric composition of GJ 1214b. In May 2010 I conducted transit observations in K-band with MMT/ARIES (Arizona Infrared imager and Echelle Spectrograph), which employs the low thermal background and high throughput offered by the MMT’s f/15 adaptive secondary. Due to the limited (small-width) slits available, we implemented a novel “slitless-spectroscopy” mode, effectively performing broadband photometry with a 6.5 m telescope and an AO-fed instrument. The AO was used to maintain target stability (versus traditional guiding), but we experienced multiple breaks of the AO loop, and also suffered from intermittent clouds and high winds that caused truncation of the post-transit baseline almost immediately after GJ 1214b’s egress. Despite these challenges, and the unsophisticated method of observing, we were able to extract a transit depth in K-band consistent with the other measurements made at that time (in 2010).
To reduce/extract and analyze the “slitless spectroscopic” data from ARIES, I helped write and test a pipeline in IDL, which included de-correlating the transit signal with airmass and other systematic variables (e.g., spatial position and FWHM of the signal on the detector) and fitting for transit depth. Due to the preliminary nature of our results in May 2010 (few other published observations of GJ 1214b existed at the time for comparison), and the non-optimal quality of our data, we did not publish these results immediately, and they quickly became obsolete with higher quality, higher-resolution of other observers. However, my experience with MMT/ARIES observations and data reduction has prepared me to conduct future observations on similar instruments.
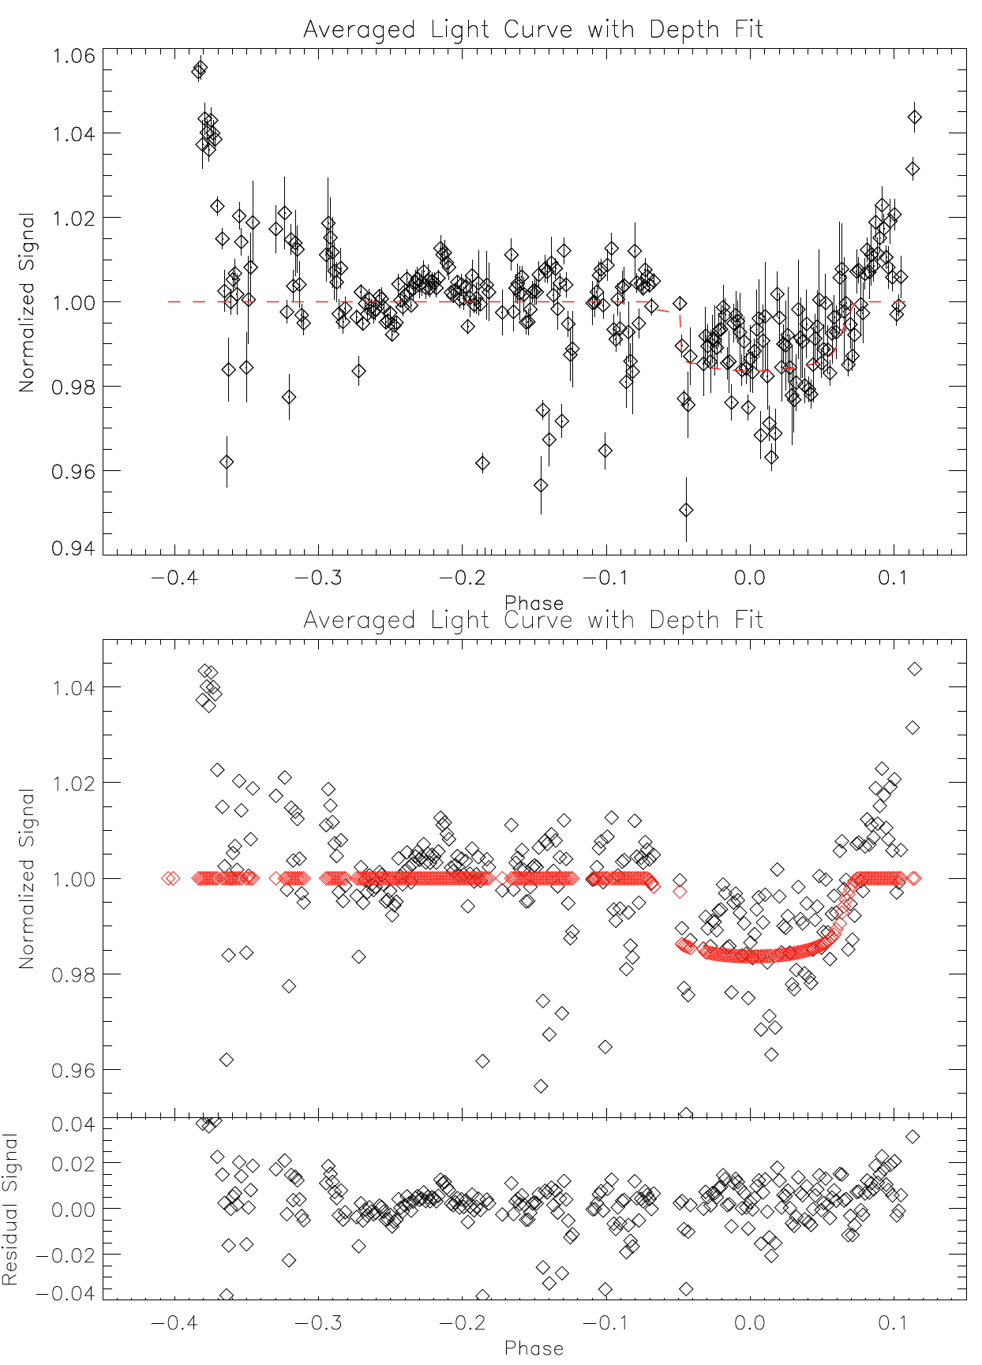
Above: Transit of GJ 1214b measured with MMT/ARIES slitless spectroscopy in K-band. Top: The averaged light curve is created by averaging each time (frame) over all wavelengths, and the error bars are based on the standard error of the mean within each time series. The red dashed line shows our fitted light curve model. Bottom: The same averaged light curve as in the top plot, shown without error bars for clarity. In red is our final resulting model. In the very bottom panel are the residuals from the fit, i.e., the black - red data from the top plot.
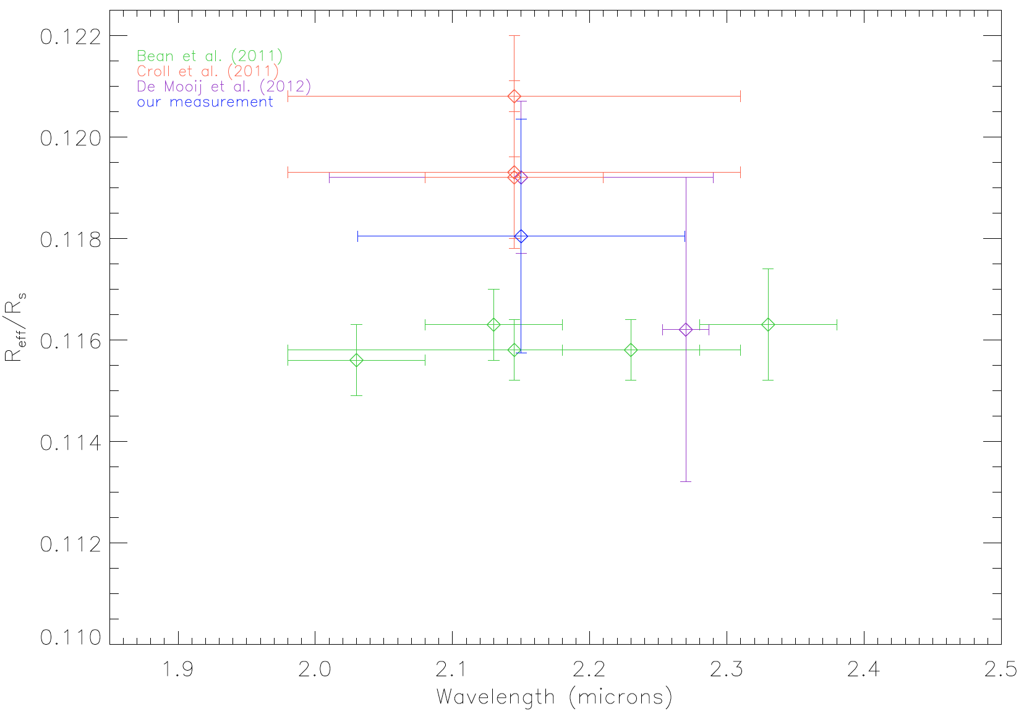
A comparison of previous primary transit data for GJ 1214b, compiled from Figure 8 of Howe & Burrows (2012), with our new broadband point (reflecting our first analysis approach, using the error derived from the standard error of the mean) over-plotted as a dark blue diamond.
I moved on to constraining the other contended region of GJ 1214b’s spectrum, in the optical regime. My specific goal was to prove or refute the reported short-wavelength (g-band, ~0.5 μm) increase in GJ 1214b’s transmission spectrum (de Mooij et al. 2012; Murgas et al. 2012), versus the rest of the relatively flat spectrum. This increase is roughly consistent with Rayleigh scattering in an atmosphere with a relatively high scale height. Scattering by a haze would not be surprising; for example, at the temperature of GJ 1214b’s atmosphere (~500 K) most of the carbon is expected to be in CH4, which photolyzes readily producing organic haze, as seen in the atmospheres of Jupiter and Titan.
My collaborators and I conducted many small-telescope observations of transits of GJ 1214b on both the Kuiper 1.55m and 1.2m STELLA-I robotic telescopes in three optical bands. The Kuiper 1.55m telescope is observer-operated; I was trained on how to perform all operations and emergency procedures. I reduced the data using standard IRAF photometry routines, and modeled the transit depth using several different transit analysis programs (which I tested against each other). Our results (based on a greater number of nights) were consistent with previous results, but they also allowed for a shallower radius. This suggests that (Rp/Rs) may not increase significantly at shorter wavelengths, and that GJ 1214b’s atmosphere may have a high mean molecular weight (be water-dominated). We also analyzed our out-of-transit data to check for the influence of star-spots on our transit depth measurements, and found that the maximum correction that could affect the measured transit depth was within our derived errors.
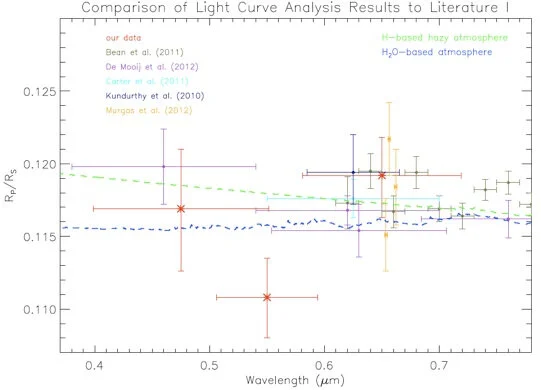
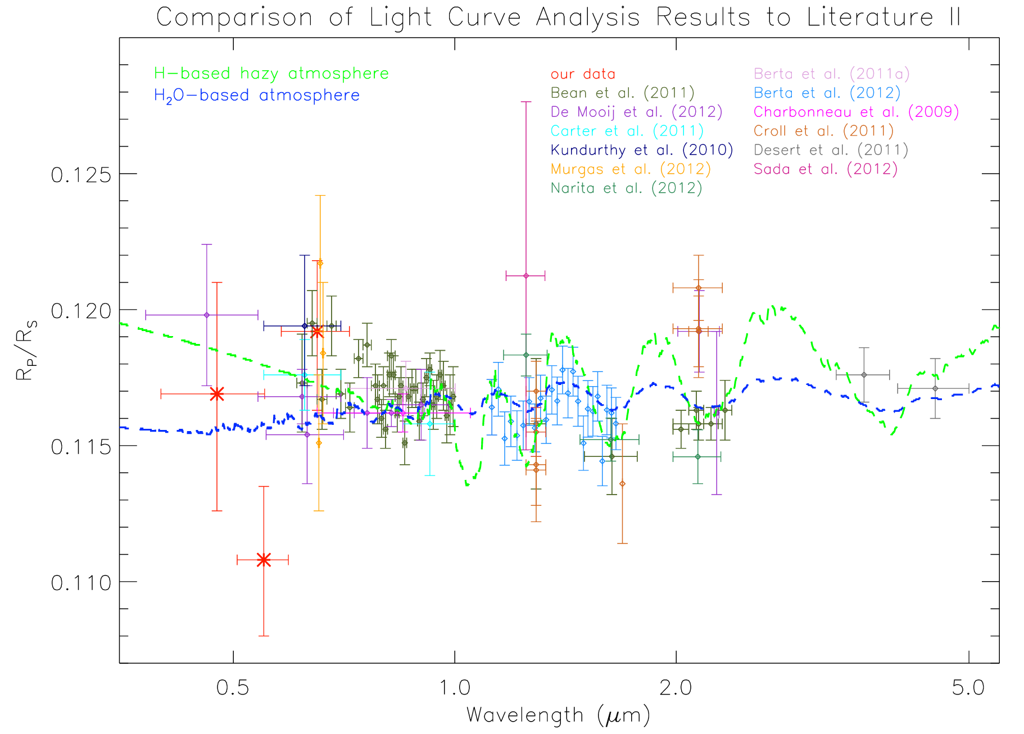
Above: The results of our combined-night analyses, as compared to other published transit measurements of GJ 1214b. Our results are bolded in red; the band-pass error bars on our measurements represent the FWHM of each filter. We overplot two examples of end-member models that are consistent with different selections of the existing data: a hydrogen-based and hazy atmosphere with a solar abundance of water (green) and a water-based atmosphere (blue). The former displays a greater modulation in the spectral features as a result of the higher scale height of the H2-based atmosphere.